Hover to pan and click to magnify. Click again to pan at full screen.
Jahansooz AS, MA; Schadegg, JD, BA; Badgett RG, MD
Jahansooz AS, MA; Schadegg, JD, BA; Badgett RG, MD
Internal Medicine, KU School of Medicine
Wichita
Background
Positive deviance (PD) has been used successfully in clinical care but not applied to medical
education. We explore the appropriateness of PD as a method of faculty developed by examining the
heterogeneity in faculty assessments by students. High heterogeneity in performance supports the
role of PD for organizational learning.
Methods
We developed a new end
of rotation survey for our
Internal Medicine clerkship as we believe our new
survey better matches educational . As part of this
process, we are examining the role of positive
deviance to improve our teaching.
Each question was analyzed with a random effects
analysis to determine weight rates and statistical
heterogeneity. Heterogeneity was qualified with the
Cochrane scale (right).
Modified Cochrane scale (Cochrane):
0% to 30%: might not be important;
30% to 50%: may represent moderate heterogeneity
50% to 75%: may represent substantial heterogeneity
75% to 100%: considerable heterogeneity
Results
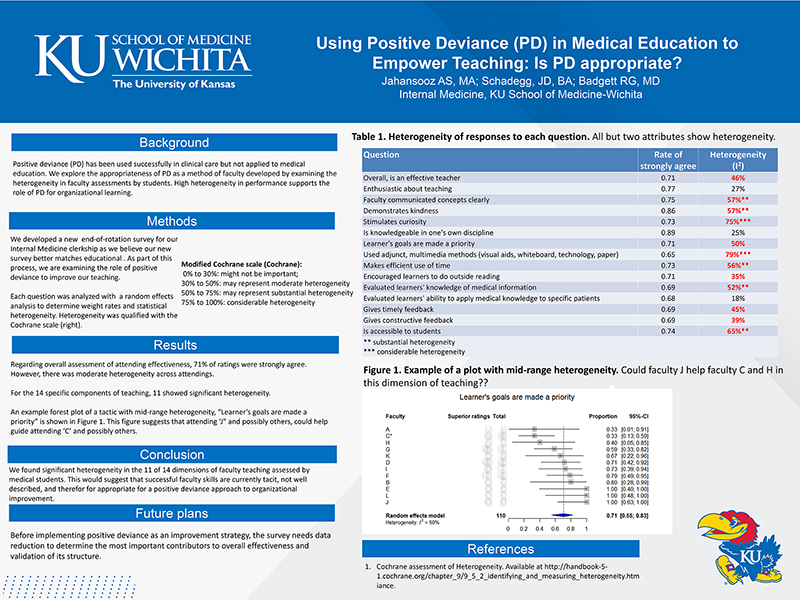
Regarding overall assessment of attending effectiveness, 71% of ratings were strongly agree.
However, there was moderate heterogeneity across attendings.
For the 14 specific components of teaching, 11 showed significant heterogeneity.
An example forest plot of a tactic with mid
range heterogeneity, “Learner’s goals are made a
priority” is shown in Figure 1. This figure suggests that attending ‘J” and possibly others, could help
guide attending ‘C’ and possibly others.
Conclusion
We
found significant heterogeneity in the 11 of 14 dimensions of faculty teaching assessed by
medical students. This would suggest that successful faculty skills are currently tacit, not well
described, and therefor for appropriate for a positive deviance approach to organizational
improvement.
Future plans
Before implementing positive deviance as an improvement strategy, the survey needs data
reduction to determine the most important contributors to overall effectiveness and
validation of its structure.
Table 1. Heterogeneity of responses to each question.
All but two attributes show heterogeneity.
(View poster)
Figure 1. Example of a plot with mid
range heterogeneity. Could faculty J help faculty C and H in
this dimension of teaching??
(View poster)
References
1.
Cochrane assessment of Heterogeneity. Available at http://handbook 5
1.cochrane.org/chapter_9/9_5_2_identifying_and_measuring_heterogeneity.htm
iance .

Present with Google Meet
Invite as many as 30 people, and present your poster in high definition. Transcription option is available. Free to use.
DISQUS COMMENTS WILL BE SHOWN ONLY WHEN YOUR SITE IS ONLINE